
FF Flow Analysis: Examining the 6% Increase and Insights from the Data

Recent Price Action and Volume Analysis
Shares experienced a notable 6.28% jump to end the session at $4.57, bringing the price close to its 52-week peak of $4.94—a significant resistance area. While the immediate price movement hints at a potential breakout, the underlying trading volume tells a more cautious story.
This rally occurred on relatively light volume, with only 465,490 shares traded, well below the typical daily average of 571,450. Such a lack of volume during a strong upward move often signals that the breakout lacks solid buying interest and may not be sustainable.
In summary, the recent surge has set up a technical scenario that could reverse course. Approaching a major resistance level without robust volume suggests the rally may be stretched and susceptible to a pullback. If the price falls below the $4.40–$4.50 support zone, it would confirm underlying weakness.
Momentum Indicators and Overbought Conditions
The bullish outlook is supported by a classic golden cross: the 50-day moving average at $3.80 sits above the 200-day moving average at $3.60, indicating strong short-term momentum. However, signs of exhaustion are emerging.
The Relative Strength Index (RSI) is currently at 71.2, placing the stock firmly in overbought territory. Historically, RSI readings above 70 often precede price corrections, suggesting the recent rally may be overdone. Additionally, the Average True Range (ATR) stands at 0.288, reflecting heightened volatility and the potential for sharp price swings—further increasing the risk of a reversal.
These mixed signals create a challenging environment. While moving averages point to continued strength, the overbought RSI and elevated volatility suggest the rally may not be sustainable. The stock is currently near resistance at $4.59, a level it has struggled to surpass. This combination of factors points to a high-risk scenario, with the next significant move likely to test support at the 50-day moving average of $3.80.
Strategy Backtest: RSI(14) Oversold Long-Only Approach
Strategy Overview: This long-only strategy for FF initiates a position when the 14-day RSI drops below 30 and exits when the RSI rises above 70, after 20 trading days, or upon reaching a take-profit of +8% or a stop-loss of -4%. The backtest covers the period from March 9, 2024, to March 8, 2026.
- Entry Condition: RSI(14) < 30
- Exit Conditions: RSI(14) > 70, or after 20 trading days, or take-profit at +8%, or stop-loss at -4%
- Risk Controls: Take-profit: 8%, Stop-loss: 4%, Maximum holding period: 20 days
Backtest Results
- Total Return: -6.82%
- Annualized Return: -7.68%
- Maximum Drawdown: 22.19%
- Profit-Loss Ratio: 1.42
Trade Statistics
- Total Trades: 6
- Winning Trades: 2
- Losing Trades: 4
- Win Rate: 33.33%
- Average Holding Period: 6.83 days
- Max Consecutive Losses: 3
- Average Gain per Win: 10.28%
- Average Loss per Trade: 6.38%
- Largest Single Gain: 11.47%
- Largest Single Loss: 10.96%
Key Levels: Support, Resistance, and Market Focus
The stock’s next significant move will depend on how it navigates two critical price zones. The main resistance is at $4.59, which aligns with the recent 52-week high of $4.94 and has previously halted upward momentum. On the downside, primary support is at $3.04, with the 52-week low at $3.09 acting as a safety net. A drop below these levels would indicate a loss of short-term strength.
The recent five-day rally of 6.62% was fueled by an average volume of 4.21 million shares, significantly above the daily average of 571,450. This suggests strong buying interest during the rally, but it also raises the question of whether such volume can be maintained. If volume fades, the price could become vulnerable to a reversal.
In conclusion, the stock is currently trading between major support and resistance. A convincing move above $4.59, supported by robust volume, could pave the way for a test of the $4.94 resistance. Conversely, failure to hold above $4.59—especially if accompanied by weak volume—would likely lead to a retest of support at $3.04. Traders should closely monitor volume at these critical levels to assess the strength of the next move.
Disclaimer: The content of this article solely reflects the author's opinion and does not represent the platform in any capacity. This article is not intended to serve as a reference for making investment decisions.
You may also like
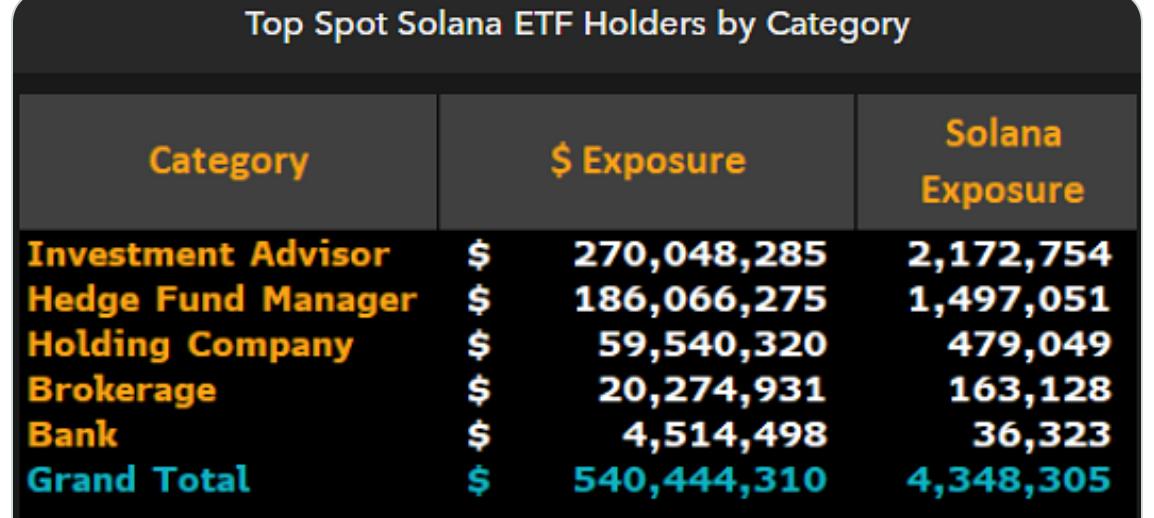
Wall Street funneled $540M into US Solana ETFs in Q4: Bloomberg
European freight truck makers brace for wave of low-cost Chinese rivals
IR (Infrared) 24-hour price fluctuation reaches 40.2%: trading volume slightly expands as support level is tested