
MSFT (1H) Update: Structure Still Supports a Bottom Formation

By:TradingView
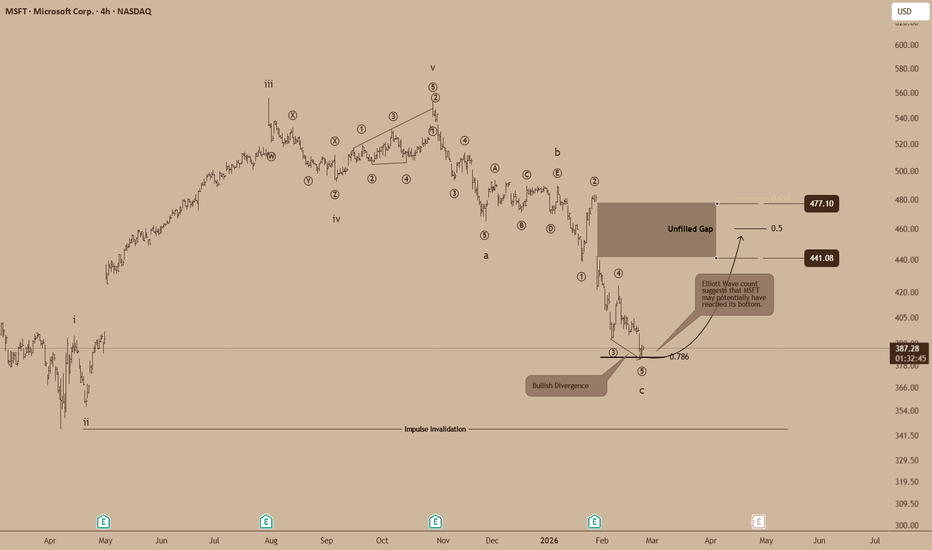
In my previous analysis of Microsoft Corporation (MSFT), I explored the possibility that the market was completing a corrective structure that could lead to a larger upside move.
The price action since then continues to respect that scenario.
The recent decline appears to have completed a potential wave C, with price reacting around the 0.786 Fibonacci retracement. This area also coincides with a local support region and the emergence of bullish divergence, suggesting that selling pressure may be weakening.
At the moment, the structure on the lower timeframe shows the early development of a potential impulsive sequence from the lows. While the move is still developing, the key idea remains unchanged.
As long as price does not create a new low beyond the 0.786 retracement, the current wave count suggesting a completed corrective structure remains valid.
If the market continues to build higher lows from this region, the next objective would be a recovery into the unfilled gap area above, with the 0.5 and 0.618 retracement levels acting as potential targets.
This zone may also act as a reaction area where the market decides whether the move evolves into a larger bullish continuation or simply a corrective bounce.
For now, the technical outlook remains constructive, but the 0.786 level is the key invalidation point for the current bullish scenario.
0
0
Disclaimer: The content of this article solely reflects the author's opinion and does not represent the platform in any capacity. This article is not intended to serve as a reference for making investment decisions.
PoolX: Earn new token airdrops
Lock your assets and earn 10%+ APR
Lock now!
You may also like
BofA Reinstates Coverage of Mastercard Incorporated (MA) With a Buy Rating
Finviz•2026/03/10 09:54

As the conflict in Iran disrupts global energy routes, Russia stands out as the primary beneficiary
101 finance•2026/03/10 09:54
3 Lucrative Stocks We Choose to Overlook
101 finance•2026/03/10 09:51
South Korean Courts Consider Writing Off Crypto Investment Debts in Personal Bankruptcy Cases
CoinEdition•2026/03/10 09:51
Trending news
MoreCrypto prices
MoreBitcoin
BTC
$71,085.35
+4.39%
Ethereum
ETH
$2,069.34
+3.13%
Tether USDt
USDT
$1
+0.03%
BNB
BNB
$647.77
+3.10%
XRP
XRP
$1.42
+4.44%
USDC
USDC
$1
+0.01%
Solana
SOL
$87.26
+3.66%
TRON
TRX
$0.2857
-0.74%
Dogecoin
DOGE
$0.09509
+4.85%
Cardano
ADA
$0.2669
+3.78%
How to buy BTC
Bitget lists BTC – Buy or sell BTC quickly on Bitget!
Trade now
Become a trader now?A welcome pack worth 6200 USDT for new users!
Sign up now